- Fall 2020
Analysis of the Impact of In-Place Air Voids on Pavement Performance

Air voids are an important parameter in asphalt pavement construction. If air voids are too high or too low, pavement life can be reduced. The objective of NCHRP Project 20-50 (18) was to determine the effects of as-constructed air voids on performance using field data from the Long-Term Pavement Performance (LTPP) program. Although a similar study was conducted in 2001 under NCHRP Project 20-50 (14), revisiting the topic was warranted because a much larger LTPP dataset is now available. The study focused on performance related to four distress types: rutting, fatigue cracking, thermal cracking, and roughness. A major challenge was isolating the influence of air voids from the many other factors affecting performance, including climate, traffic, and pavement structure. Three analysis methods were used: (1) dividing the LTPP sections into common data subgroups to help isolate the effect of air voids, (2) using regression modeling, and (3) using an artificial neural network (ANN). Validation efforts were conducted using data from the NCAT Test Track and the Minnesota DOT’s MnROAD facility.
Data from 426 LTPP test sections were extracted with a nearly even split between new construction and rehabilitated sections. All of the sections had a minimum of five years of field performance monitoring (over half had more than ten) and at least three distress surveys (over two-thirds had more than eight). All four climate regions were represented with a higher proportion from wet-no freeze and wet-freeze regions. As-constructed air voids ranged from 1% to more than 14%. The mean of all wheel path as-constructed air voids was slightly lower than the mean of all non-wheel path air voids, reflecting a delay between when sections were opened to traffic and when the LTPP team collected as-constructed data. Where available, non-wheel path air voids were used for the analysis. Data for all asphalt layers was needed to account for performance related to the surface (rutting and thermal cracking) as well as full depth (fatigue cracking).
LTPP cracking data was recorded relative to physical location rather than cause; therefore, this study used wheel path cracking to quantify fatigue cracking and used transverse cracking to quantify thermal cracking. Sections with porous surface mixes were removed from the study due to their high air voids. Different dates were selected to initiate performance time: open to traffic date for rutting, fatigue cracking, and roughness; construction completion date for thermal cracking; and LTPP assignment date for rehabilitation sections that had no other dates recorded. Some sections experienced additional construction events during the monitoring period; those events that resulted in significantly different performance were considered as separate analysis periods.
Assembling and processing the data was time intensive, requiring additional steps to develop a reliable and complete dataset for analysis methods 2 and 3. This dataset included more detailed climate, material stiffness, and layer thickness variables than the dataset used in method 1. Layer attributes were combined into LTPP section-level attributes; for example, a representative air voids value was computed for each section as the average of air voids for each layer weighted by layer thickness. For variables other than air voids with a low percentage of missing values, approximate values were determined by predictive models. The final analysis dataset for each performance type included section attributes merged with time-dependent data (climate and traffic) for each performance measure.
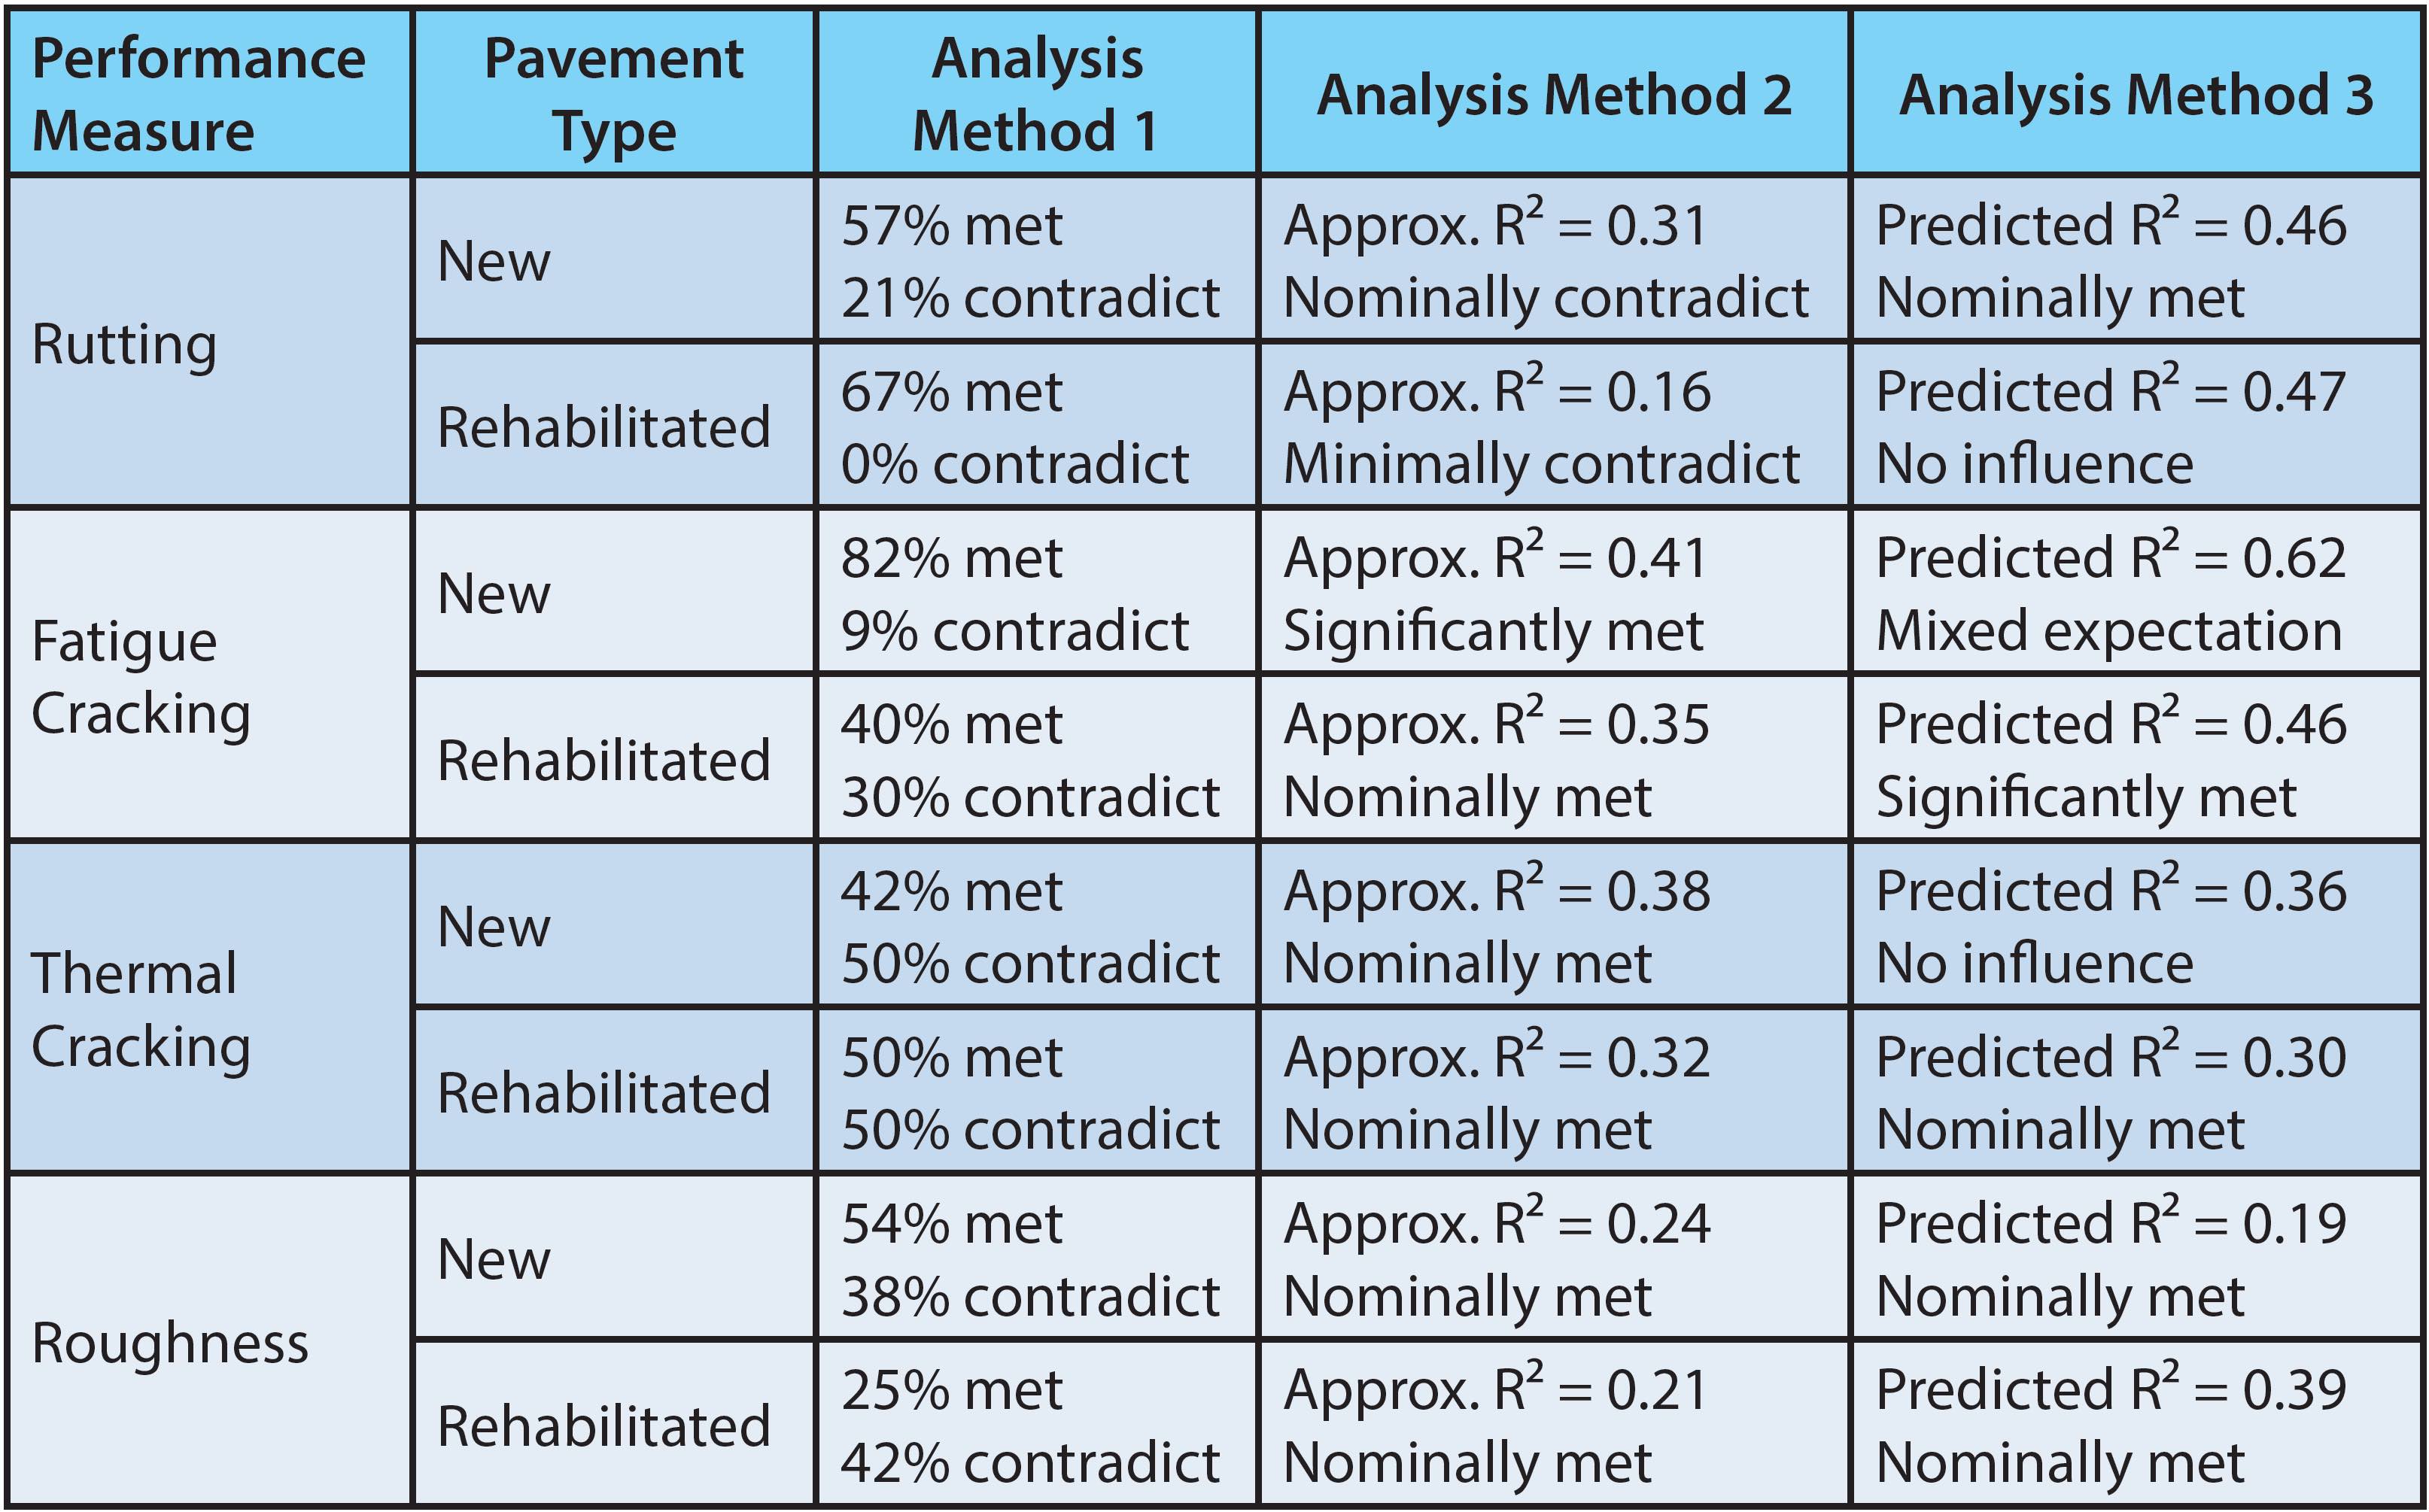
Analysis method 1 created a matrix of 48 subgroups delineated by climate, traffic, and pavement structure such that similar performance was expected in each subgroup, with as-constructed air voids being a distinguishing factor. A total of 27 subgroups had a sufficient number of LTPP sections for analysis. From each section’s performance curve, representative values were established for each distress. Rutting was evaluated at four, six, and eight years as well as the time to reach 0.3 inches of rutting. The performance criteria for fatigue cracking was the percentage of wheel path cracking after 10 years. For thermal cracking, the number of years before transverse cracks appeared and the length of transverse cracking were determined. Roughness was analyzed after 10 years of traffic and the time for roughness to increase by 25 in/mi from the initial post-construction measurement. Graphs were created for each subgroup by plotting the performance value and as-constructed air voids for each section. Sections were classified as “meeting expectations” if the plot showed better performance for lower as-constructed air voids, sections were classified as “contradicting expectations” if worse performance was observed for lower air voids, and sections were classified as “no influence” if similar performance was observed over a range of as-constructed air voids. As seen in Table 1, the impact of as-constructed air voids was mixed for analysis method 1.
Analysis method 2 used statistical regressions to assess the influence of as-constructed air voids on pavement performance. Input variables were normalized so that each would be weighted equally in the analysis. A separate model was developed for each combination of pavement type and distress. Each model was fitted to a typical curve for each distress considering model fit and complexity. For analysis method 2, the influence of air voids was also mixed. Table 1 lists approximate R2 for each model and whether the model prediction met or contradicted expectations. A series of performance curves created using average input variables and incremental as-constructed air voids are available in the User Guide prepared for the project.
Analysis method 3 used an artificial neural network (ANN) to examine the influence of as-constructed air voids. ANN is an adaptive information processing approach that establishes correlations between input and output variables through interconnected neurons (weight factors) that are adjusted using a minimum error function. Eight models were developed – one for each combination of pavement type and distress – each having slightly different input parameters (climate, traffic, material, and structure characteristics) and different numbers of neurons within the ANN architecture. For each model, LTPP sections were randomly divided into two groups: a training-validation cluster used to develop the ANN model and a test cluster used to evaluate model prediction accuracy. Training-validation clusters were further subdivided into training and validation subsets. The ANN model predictions and measured pavement performance were generally in good agreement within the training-validation clusters. Prediction accuracy was lower for the test clusters, which may be attributed to measurement variations within individual parameters as well as the relatively small dataset with respect to the diversity of the LTPP sections. Overall, the ANN models had better prediction accuracy than the regression models developed in analysis method 2. As shown in Table 1, the influence of as-constructed air voids for analysis method 3 was also mixed.
Broadly speaking, this study concluded that lower as-constructed air voids have a positive impact on asphalt pavement performance. However, the influence is not consistent among the types of distress and type of project (new construction or rehabilitation).
Table 1. Summary of Analysis Results
Validation of these results involved two approaches. The first compared analysis method 1 results with AASHTO Pavement ME predicted performance (rutting and fatigue cracking) over a range of air voids. Nine LTPP sections were selected from two subgroups (dry-no freeze and wet-no freeze, both with medium thickness and low traffic). The Pavement ME rutting and fatigue trends agreed with the study for the dry-no freeze subgroup but differed for the wet-no freeze subgroup. The second validation approach compared actual performance at MnROAD and the NCAT Test Track to predicted performance using the models developed with each analysis method. Data from both sources were filtered to exclude sections with porous surface mixes as well as sections outside the range of pavement structures and traffic conditions seen within the LTPP dataset. Because the Test Track uses accelerated loading (approximately 10 years of heavy loading applied within a two-year cycle), a time shift was applied to the performance curves to approximate normal traffic. The regression models developed using analysis method 2 were applicable to some but not all cases for MnROAD and the Test Track. The ANN models developed using analysis method 3 better fit the LTPP data but were not applicable to the MnROAD and Test Track data. Caution should be used when applying these models to parameters outside the LTPP dataset.
The results of this study will provide better information for agencies to determine if their construction standards should be modified to improve pavement performance. This decision will be based on how well the agency’s climate and pavement program compares to the data used in this study. Implementation guidance is contained in the report, as well as direction for agencies that want to perform an in-house study with their own data.

For more information about this article, please contact Michael Heitzman.