- Fall 2020
Identifying Potential Bias Between IDEAL-CT Machines
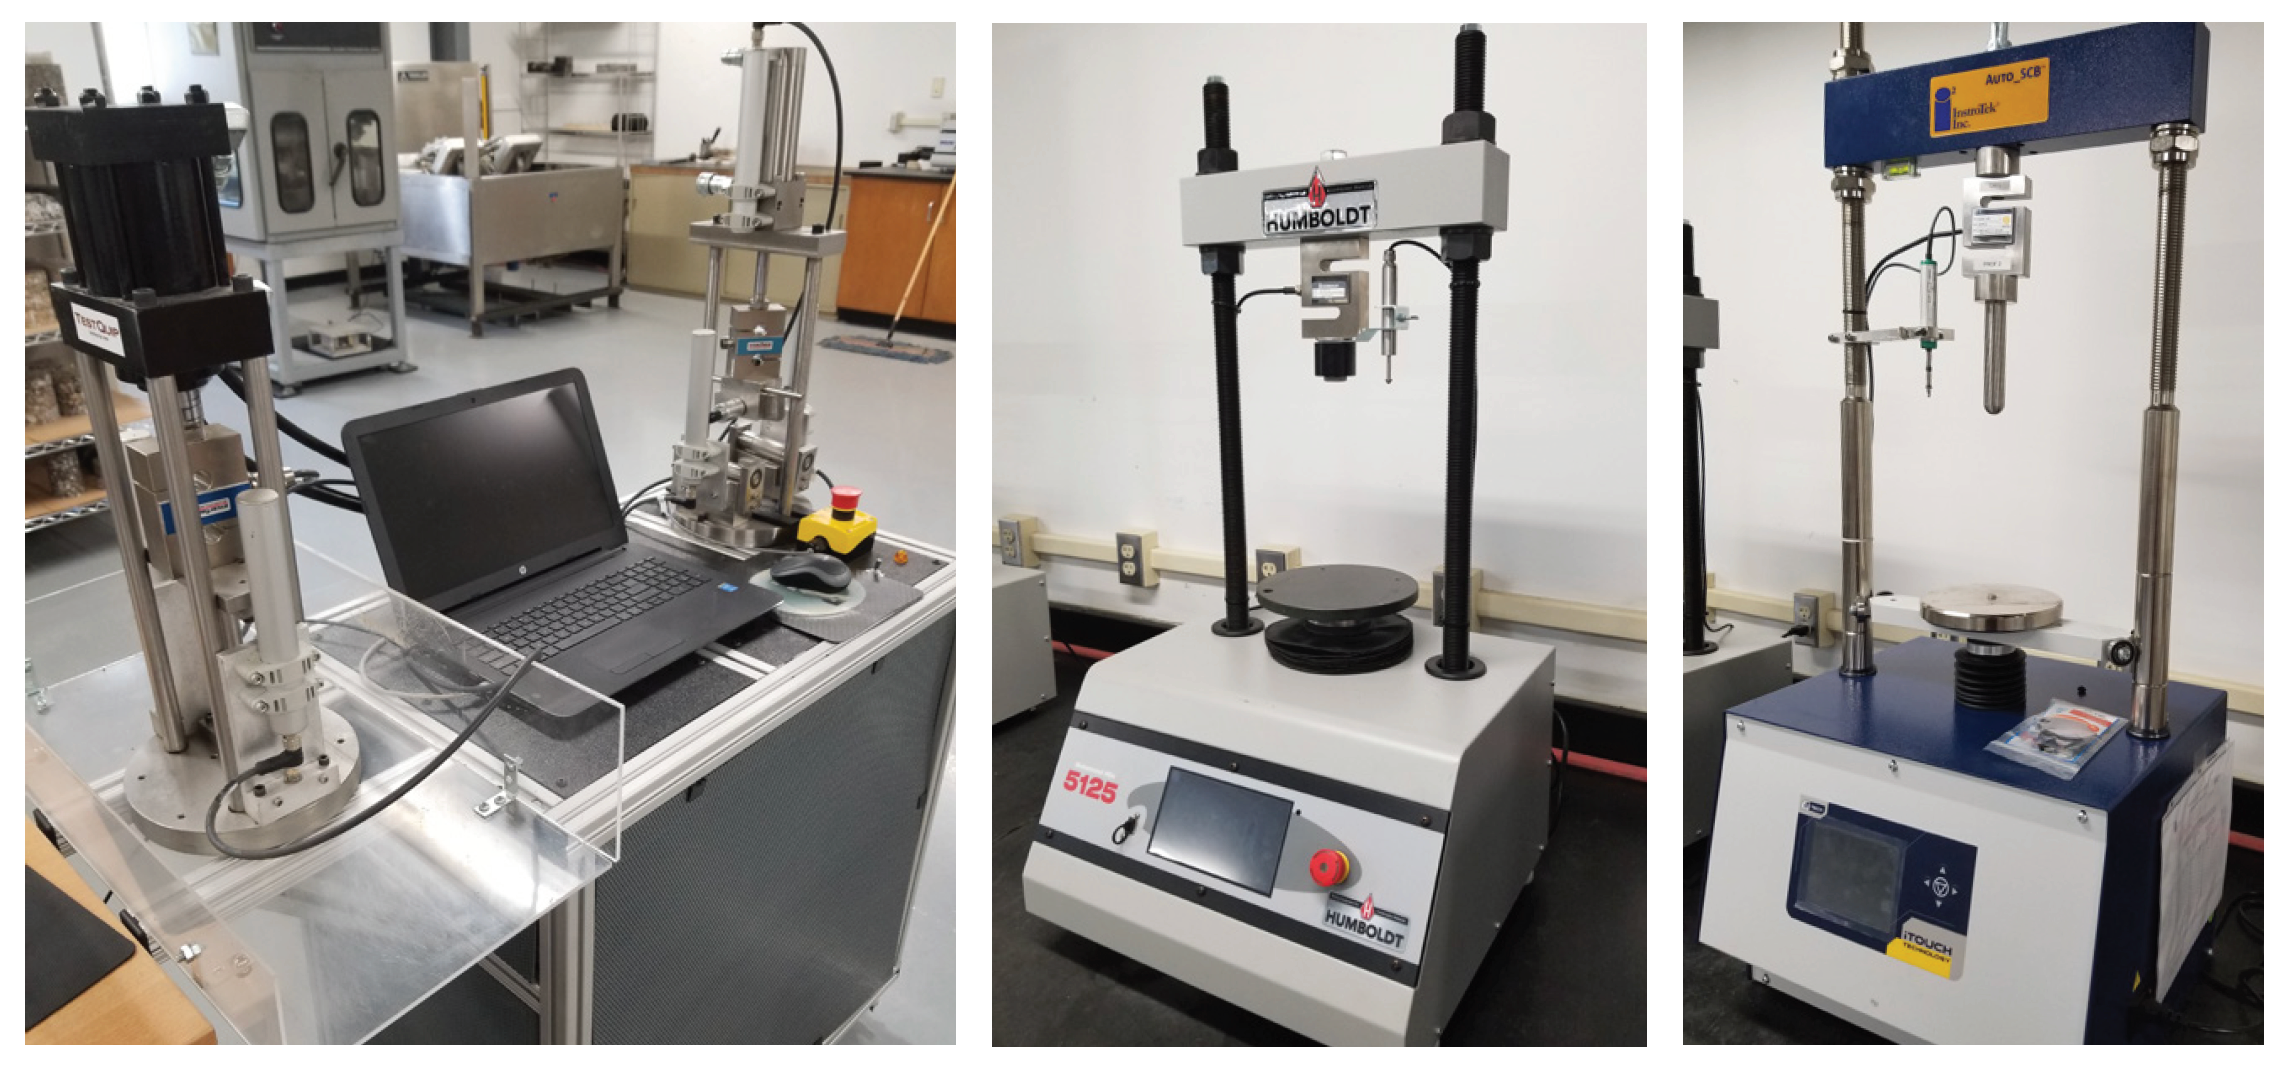
Left to Right: Troxler / TestQuip, Humboldt, and Instrotek machines
Many contractors are beginning to conduct their own performance testing to benchmark their mixes and determine how to adjust them. In states that are moving toward balanced mix design, performance test results will be part of mix design submissions for approval to their particular agency.
Inevitably, differences in testing results will occur from one lab to another. This happens for a variety of reasons, but the most common have to do with differences in sampling, testing, or the materials. Proper training, sampling best practices, and systematically following a procedure can dramatically reduce or limit variability in testing results. Following proper and consistent specimen preparation practices is the best way to reduce testing variability. One source of variability between-labs is differences in the testing devices. The magnitude of these effects is often unknown because they are very difficult to isolate. An ongoing study at NCAT is investigating differences in IDEAL-CT test equipment and how to establish an estimate of machine-to-machine bias using six common test machines/devices and seven different mixtures.
Mix designers often go to great lengths to minimize sources of variability and bias, so machine to machine bias should be treated the same way. The significance of bias between machines will depend on the situation. If a mix is designed and/or produced on the fringes of the agency’s specification, there is greater risk of having a mix rejected or subject to additional time-consuming testing. Knowing that mix rejection could hinge on differences between test devices would allow the contractor to make a necessary adjustment.
Researchers at NCAT are evaluating differences between test machines on the IDEAL-CT results by carefully preparing specimens to minimize sampling and materials variability. Each specimen is prepared the same way from splitting, heating, compacting, bulking, conditioning, and testing to minimize variability. Preliminary analysis shows that over half of the machine-to-machine comparisons yielded differences of 10-30% of the average CTindex for a particular mix. The average difference between two machines was 6 CTindex units (and ranged from 0 to 21 units).
A difference of 6 units may seem insignificant but consider this example. A state implementing BMD sets a CTindex minimum threshold of 50. A contractor prepares a mix design with a CTindex of 55 (tested in their own lab) and submits the mix to the state for testing. Based on the distribution of possible differences between machines from the NCAT study, the contractor would have a 50% chance of having their mix fail to meet the acceptance criteria by dropping 6 CTindex units to a 49, even if the contractor made the specimens themselves.
Contractors could make specimens from a few mixes in their own labs and have them tested at the agency’s lab to help establish if a bias exists between the two machines. Taking care to prepare specimens as consistently as possible to reduce variability between specimens and randomly splitting the specimens into two groups such that the average air void contents are equal will help isolate differences caused by machines. Ultimately, the process of establishing bias is very important and must be done well to avoid overestimating bias. An upcoming NCAT report will include a case study of this procedure and examples of data analysis. A framework for the determination of bias will be discussed further in that report.

For more information about this article, please contact Nathan Moore.