- Spring 2024
Advancing Asphalt Quality: Wisconsin DOT’s Road to Balanced Mix Design
The Wisconsin Department of Transportation (WisDOT) has devoted significant research efforts in recent years toward implementing balanced mix design (BMD) to improve the performance of their asphalt mixtures. A 2021 benchmarking study by NCAT used HWTT and IDEAL-CT methods to test existing WisDOT-approved mix designs, determining the distribution of test results that satisfied preliminary performance criteria1. Since then, WisDOT has continued to refine these benchmarks, culminating in the latest criteria outlined in Table 1. The HWTT corrected rut depth at 20,000 passes is used to ensure robust rutting resistance, the HWTT number of cycles to the stripping number (LCSN) is used to assess moisture susceptibility, and the IDEAL-CT CTIndex is proposed for resistance against load-related cracking in surface layers.
Table 1. WisDOT BMD Criteria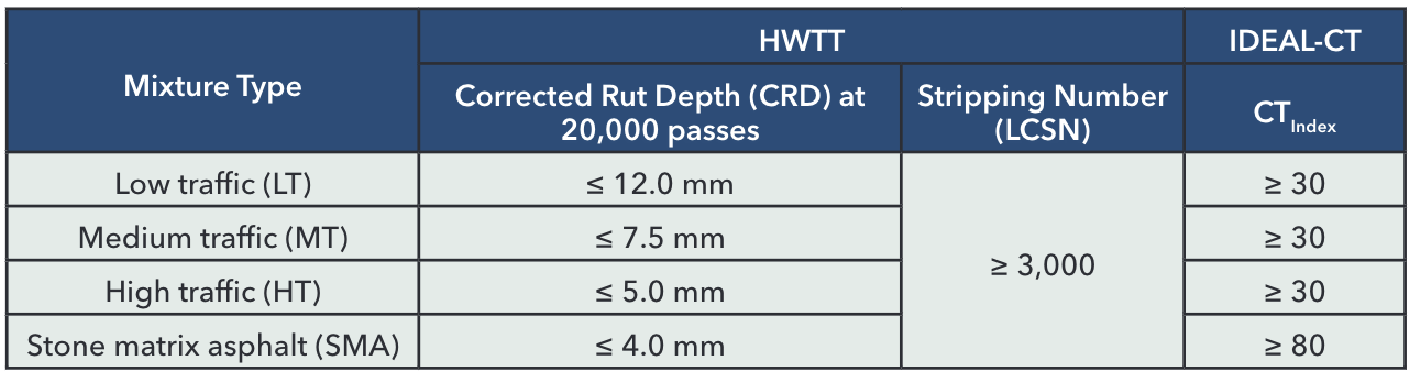
In 2023, NCAT completed another study for WisDOT focusing on two important steps in the BMD implementation process: (1) validating BMD tests and criteria by constructing BMD test sections, and (2) conducting shadow projects to assess the overall variability of BMD test results in mix production settings. This first step is crucial for establishing a robust correlation between test results and field performance, thereby facilitating the development of appropriate specification criteria for quality assurance and mix design approval. Similarly, the second step is essential for determining the production variability statistics needed to set appropriate quality assurance specifications.
In the first phase of the study, the research team collaborated with WisDOT to design six test sections for the BMD validation experiment. It was critical to include sections with a diverse range of expected field performance to encompass BMD test results both above and below the proposed criteria. This is fundamental, as the ultimate objective of BMD is to enable agencies to specify mix criteria independent of mix composition. Table 2 shows the desired ranges for IDEAL-CT and HWTT results across the six Wisconsin test sections. BMD test results yielded CTIndex values spanning from 17 to 99, while HWT CRD20k values ranged from 2.8 to 10.4 mm.
Table 2. Experimental Matrix with Six Test Sections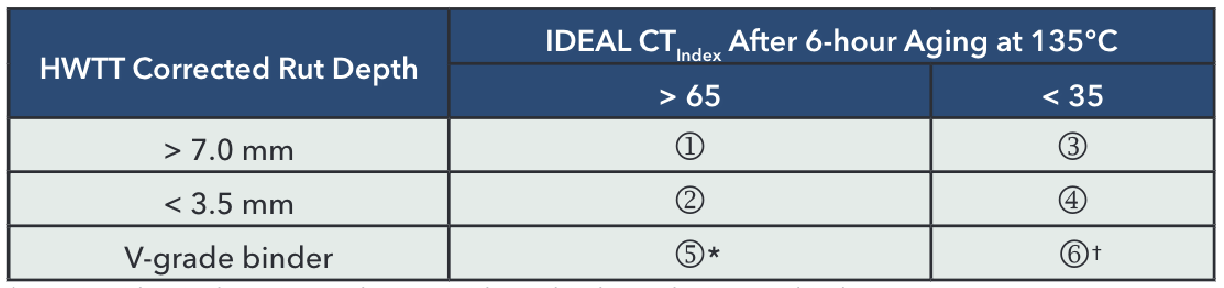
* Section identical to mixture design 1 with “V” binder replacing “S” binder.
† Section identical to mixture design 3 with “V” binder replacing “S” binder.
During construction of the test sections in October 2022, samples from each section were obtained and divided into three parts for BMD testing by the contractor, WisDOT’s central lab, and NCAT. Results from these three laboratories are summarized in Table 4, which also includes mix design results for comparison. As evident from the table, there are significant discrepancies in the results of the three labs for both tests, indicating a need for improved instructions and training to reduce lab-to-lab variations. To address this issue, the National Asphalt Pavement Association (NAPA) recently published a Guide on Asphalt Mixture Specimen Fabrication for BMD Performance Testing2.
Despite the notable differences in CTIndex and HWTT results among the labs, the ranking of the mixtures, shown in parentheses in Table 3, were similar. The range of resistance to rutting and cracking indicated by these results should provide a reliable correlation between laboratory testing and field performance. For instance, Section 1’s mixture has a relatively high CTIndex and HWTT CRD20k, suggesting greater resistance to cracking but increased susceptibility to rutting compared to other sections. Conversely, the mixture in Section 4 has the lowest CTIndex, indicating lower resistance to cracking but excellent resistance to rutting based on the HWTT results.
Table 3. HWTT and IDEAL-CT Results and Ranking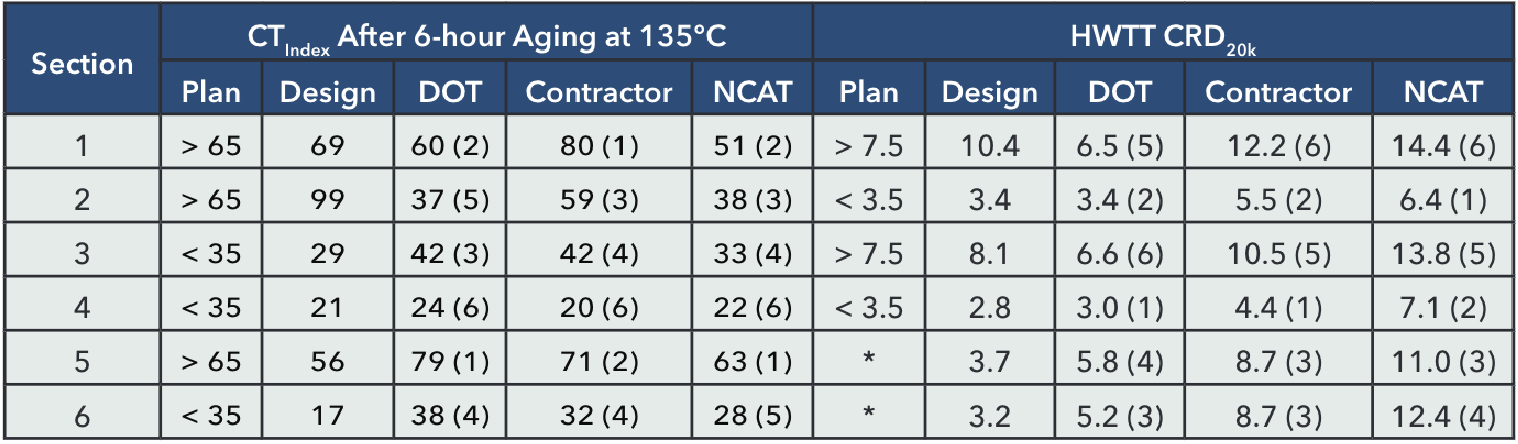
* After loose mix aging at 135°C for 6 hours.
† No specified HWTT criteria.
The second phase of the study entailed testing mixture samples sourced from ten WisDOT projects across the state to quantify production variability for the BMD test results. The shadow projects were selected to encompass variations in aggregate type, binder grade, and mix types. For each project, production samples were obtained from two or three lots. Typically, a Wisconsin lot is made of five sublots, providing 10 to 15 mix samples per shadow project.
The test results were used to quantify production variabilities for the BMD test parameters. Crucial variability metrics were summarized and used to illustrate how contractors can align mix production to meet the desired quality standards and receive full pay, as per WisDOT’s preliminary BMD specification criteria. Table 4 provides a concise summary of the production variability statistics for the BMD tests derived from the Wisconsin shadow projects, along with references to other studies documenting within-lab testing variabilities for these parameters.
Table 4. Summary of Key Statistics for Overall Production Variability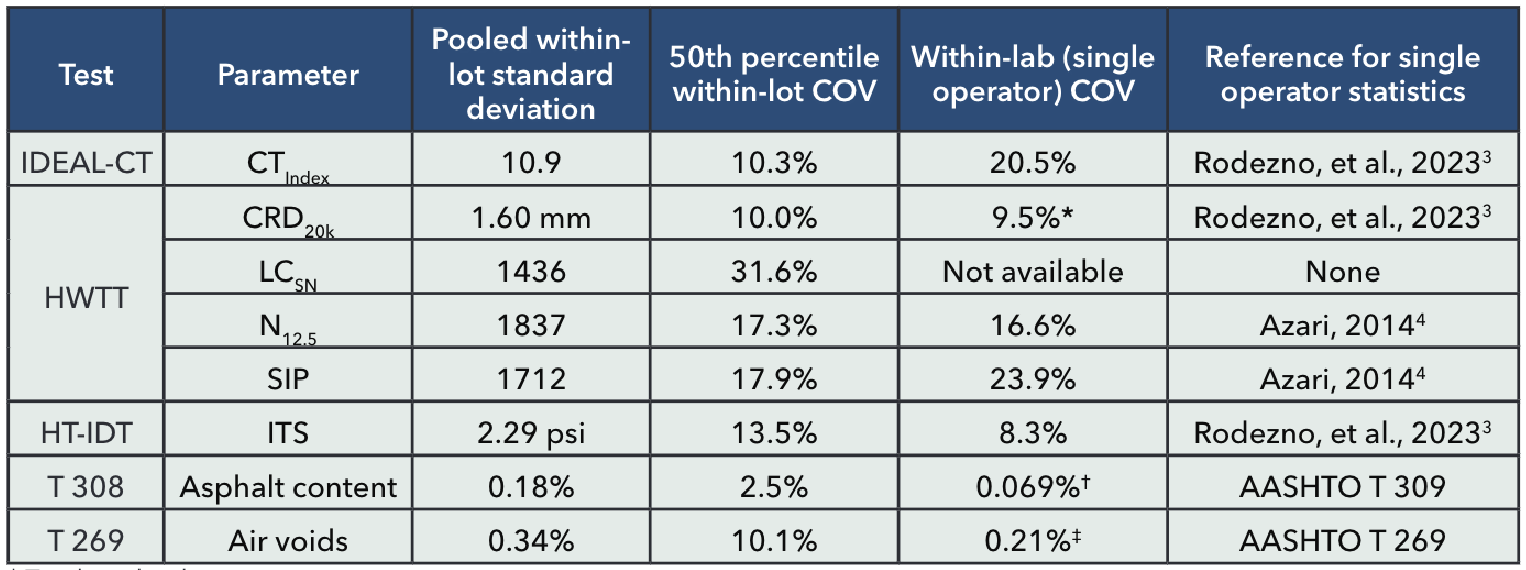
* Total rut depth at 20,000 passes.
† Single operator precision standard deviation.
‡ Single operator precision standard deviation using T 269 Method A.
The pivotal takeaway from this part of the research lies in guiding contractors on how to set their targets for mix production when these tests are used for acceptance quality characteristics. In the case of a percent within limits (PWL) specification with a 100% pay factor based on 90% compliance within specified limits, the population mean should target at least 1.282 times the within-lot standard deviation (σ) above a lower specification limit, or 1.282 times σ below an upper specification limit. Therefore, based on WisDOT’s preliminary BMD criteria and the shadow project testing outcomes, contractors should target mix production with the results shown in Table 5.
Table 5. WisDOT Preliminary BMD Criteria and Recommended Production Targets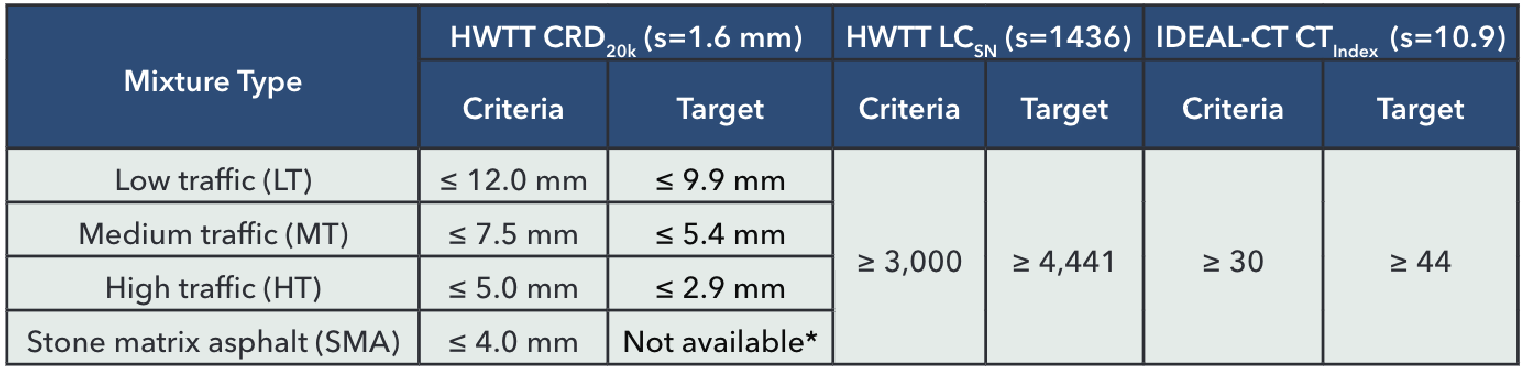
* SMA mixtures were not included in the shadow projects; therefore, standard deviations are unknown.
WisDOT is monitoring the performance of the BMD test sections and the shadow projects as they may offer valuable insights into the effectiveness of the BMD test parameters in gauging the resistance of the mixtures to rutting, cracking, and moisture damage.

Contact Carolina Rodezno for more information about this research.
- West, R., Yin, F., Rodezno, C. and Taylor, A. (2021). Balanced Mixture Design Implementation Support. (WHRP Report No. 0092-20-04) Wisconsin Dept. of Transportation.
- Moore, N., and A. Taylor (2023). Guide on Asphalt Mixture Specimen Fabrication for BMD Performance Testing, IS 145, National Asphalt Pavement Association.
- Rodezno, C. A. Taylor, and N. Moore. (2023). NCAT Completes Second Mixture Performance Test Round Robin. Asphalt Technology News, Spring 2023, Vol. 35, No. 1, Auburn University.
- Azari, H (2014). Precision Estimates of AASHTO T 324, Hamburg Wheel-Track Testing of Compacted Hot Mix Asphalt (HMA). Transportation Research Board. Washington, D.C.