- Fall 2022
What’s Happening with BMD Implementation?
Interest continues to build for using simple, yet robust balanced mix design (BMD) tests for mix design and production quality assurance. The full implementation of BMD will take several years as the asphalt community works to address several gaps and issues. This fall, NCAT will present a roadmap for implementation in a webinar followed by five regional in-person workshops as part of NCHRP 10-107. The roadmap was developed in collaboration with the FHWA and the University of Nevada, Reno.
More than 25 state DOTs have either begun implementation or have selected BMD tests and are in the process of benchmarking their current mixtures. NAPA’s BMD Resource Guide is an outstanding resource on the current implementation status of BMD in each state as well as information about each test.
One of the motivations for implementing BMD is the opportunity to better evaluate the performance impacts of recycled materials and asphalt additives. Quite simply, volumetric properties are insufficient for assessing the impacts of recycled and innovative materials, leaving most highway agencies to rely on conservative limits for reclaimed asphalt pavement and ambivalence toward new additives.
Many DOTs view BMD tests as add-on requirements to a mix designed to meet traditional volumetric criteria. This strategy, referred to as Approach A in AASHTO PP 105, makes the mix design process even harder, drives up costs, and provides virtually no opportunity to innovate. Approach B in PP 105 also begins with a mix designed to meet all volumetric criteria but allows the final optimum binder content to be adjusted to meet rutting test and cracking test criteria. Therefore, Approach B has the same disadvantages as Approach A. The third BMD strategy, Approach C, begins with selecting an initial aggregate structure in accordance with AASHTO R 35 (Superpave mix design), but then puts meeting BMD performance criteria before volumetric criteria, and includes an important note that “highway agencies should decide which existing volumetric criteria could be relaxed or eliminated without sacrificing mixture performance.” The notion to relax or eliminate traditional volumetric criteria is the realization that the BMD tests provide sufficient protection against rutting and cracking and the legacy criteria are merely a security blanket. Approach D in PP 105, referred to as Performance Design, is essentially full reliance on the selected BMD tests and criteria to yield a suitable mix design, and thus provides the best opportunity to optimize materials, additives, and proportions to simultaneously meet performance expectations and achieve more sustainable and economical mix designs.
Numerous states are benchmarking their current mixtures with the BMD tests they’ve selected. Some have expressed surprise at the range of results for their existing mixtures and have compared their results to criteria developed in other states. It is very important to realize that most BMD test results are sensitive to sample preparation. So, comparing BMD results from different organizations is not appropriate unless their mix handling procedures are carefully harmonized.
It is also important to note that benchmarking alone is insufficient to set criteria for mix design or acceptance. DOTs are strongly encouraged to confirm relationships between lab test results and field performance to build confidence that the test results are meaningful and needed to establish appropriate specification criteria. States that have been using BMD tests for many years may be able to mine data from their pavement management system’s database to build lab-to-field performance relationships. However, for this approach, the field performance data of pavements across a state or region could be confounded by factors such as differences in the condition of underlying pavements, differences in traffic, differences in time and aging, etc.
A more direct way to establish reliable lab-to-field relationships is to build field validation experiments with test sections using mixtures that have a wide range of results for the selected BMD tests. This approach was used at the beginning of Superpave implementation with the construction of SPS-9 experiments in the Long-Term Pavement Performance (LTPP) program. A few states are currently developing plans for BMD field validation experiments. Building a field validation experiment takes a great deal of planning, attention to detail during construction of the test sections, and several years of traffic and environmental exposure to obtain discernable pavement performance differences that are needed to establish lab-to-field performance relationships.
The body of knowledge on several popular BMD tests continues to grow. For example, NCAT developed a new analysis technique for interpreting IDEAL-CT results to better understand how mix design factors affect toughness and the post-peak ductile-brittle behavior of a mixture. Recall that CTindex is calculated using Equation 1, where t is the specimen thickness, Gf is the fracture energy (area under the entire load-displacement curve, |m75| is the post-peak slope at 75% of the peak load, l75 is the displacement to 75% of the post-peak load, and D is the diameter.
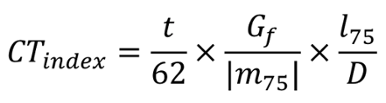
Equation 1
The new method of analysis uses an “interaction diagram” illustrated in Figure 1 to examine how a mix design change affects a mixture’s CTindex through changes in toughness and its post-peak behavior. The fracture energy term, Gf, is plotted on the y-axis, and the ratio of l75/|m75| is plotted on the x-axis. The interaction diagram includes a series of CTindex contour curves (dotted lines) that increase toward the upper right corner of the diagram. Increasing Gf and l75/|m75| will yield a higher CTindex value. However, some mix changes may increase fracture energy, but cause a decrease in the l75/|m75| ratio. As illustrated in Figure 1, increasing the asphalt content of mixtures typically increases fracture energy slightly and l75/|m75| more substantially, providing a higher CTindex. Using a polymer modified binder instead of an unmodified binder typically results in a substantial increase in Gf and also a substantial reduction in l75/m75, which may result in no change to CTindex or a slight reduction. The interaction diagram provides a new perspective for interpreting IDEAL-CT results and understanding the impacts of mixture variables. Further information about the interaction diagram can be found in the 2022 AAPT paper “Performance Characterization and Fatigue Damage Prediction of Asphalt Mixtures Containing Polymer Modified Binders and Recycled Plastics.”
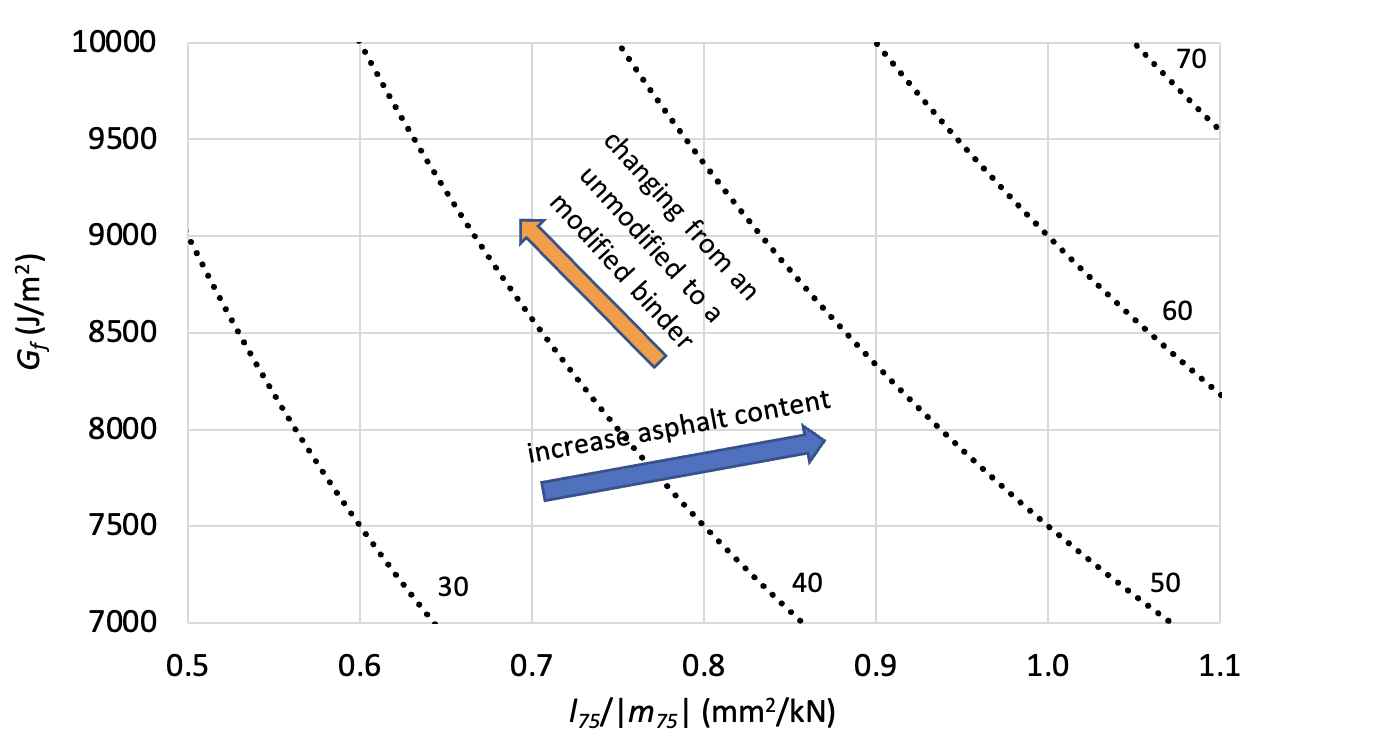
Figure 1. Ideal-CT Interaction Diagram
Exploring quicker and lower cost rutting tests for use in quality assurance is another line of research. Two simple procedures are the high-temperature indirect tensile (HT-IDT) strength test and the Ideal-Rutting Test (IDEAL-RT). The HT-IDT uses equipment that already exists in most asphalt labs; the IDEAL-RT is like the HT-IDT except for a different loading fixture. The tests are conducted on specimens prepared like the IDEAL-CT and tested at a temperature based on the high pavement temperature for the project’s climate. Preliminary data at NCAT shows that results from the two tests are very highly correlated and are also strongly correlated to the Asphalt Pavement Analyzer rutting test.
Interlaboratory studies have also provided data to establish within-lab and between-lab standard deviations for several popular BMD tests. These studies have also shown that in general, BMD test results are much more sensitive to sample preparation techniques than volumetric properties. As noted previously, detailed mixture preparation procedures must be established and followed for testing including mix conditioning, reheating, and laboratory aging to minimize differences in test results from lab to lab.
Recently, AASHTO R30 updated the short-term aging procedure of laboratory prepared mixtures to better simulate the asphalt aging and absorption that occur during mix production. Previously, R30 called for conditioning of mixture samples for four hours at the mixture’s compaction temperature prior to compaction for mechanical property tests. The 2022 revision cuts the conditioning time in half to just two hours and standardizes the conditioning temperature as 135°C for HMA and 116°C for WMA. While this change helps timing logistics for mix design work, it adds a complicated wrinkle to using existing databases of test results that were established based on the previous four-hour conditioning protocol. For example, should DOTs that previously established criteria for Hamburg Wheel Tracking Tests based on four-hour conditioning now change the criteria to accommodate the new two-hour procedure in R30?
Long-term aging also remains an unresolved issue. Most asphalt researchers and practitioners acknowledge that a long-term aging protocol is needed for proper evaluation of cracking resistance of surface mixtures. Yet there is no consensus among several loose-mix and compacted-specimen aging protocols. Research funded by the National Road Research Alliance (NRRA) is underway to understand the impacts, advantages, and disadvantages of the different loose mix aging protocols and their correlation to field aging. A research needs statement on this topic is also making its way through the process for a possible NCHRP project for 2024.
The BMD implementation guide to be presented this fall will be a helpful resource for all stakeholders and provide a full picture of the tasks ahead for designing and constructing better asphalt pavements. When the dates are set, NCAT will promote the webinar and workshops through our social media platforms.

For more information about this article, please contact Randy West.