5. Physics Selection, Effect on Electrical Characteristics, and Tracking Position Data
5.1. Objectives
- continue to develop physics understanding
- learn how to change physics models
- track internal physics quantities as a function of bias
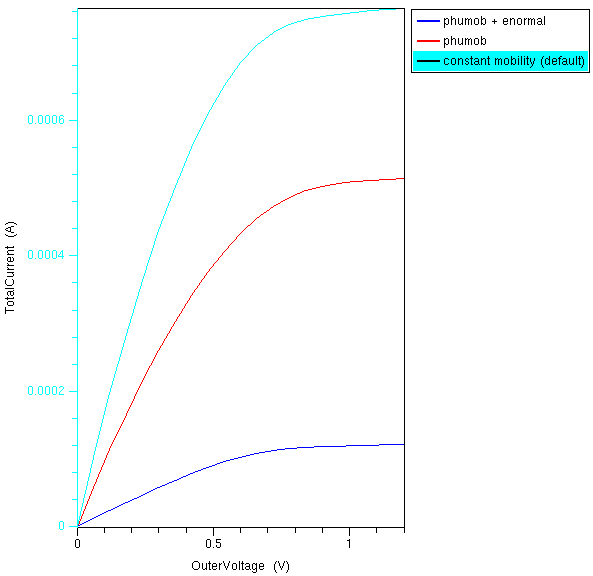
- better understand how mobility changes affect I-V
- understand low-field mobility choices
- explore velocity saturation (high field mobility) impact
- go and find the manuals, download a copy. The directory is given below.
5.2. Required Programs
- sde
- sdevice
- tecplot_sv
- inspect
5.3. Overview
See lecture notes on 3-terminal and 4-terminal MOS devices.
5.4. Files You Need
You can use the same files used previously for Id-Vd and Id-Vg. If you do not have them, download them. We will modify them a little bit as we demoed in class.
Download the files from our class sites. Use the large file which has more up to date contents. If you home directory is small, download it to a PC first and pick files you need. You can take out the *.cmd files and *.par files, and run them to generate all other files you need.
Once you download the file, go to file browser, then right click Extract here.
Typically you should put it under your home folder for ease of access, then do extraction.
5.5. Meshing
To generate the mesh, first edit structural parameters in the halomosfet_sde.cmd file. In a terminal, cd to the source file folder, just run
gedit halomosfet_sde.cmd&
For now, you do not have to change anything. Default gate length is 1.0um. You can change it to another value, e.g. 90nm to look at impact of gate length. You should find the script is written such that you can modify structural parameters easily. After editing, save the file. You do not have to close the editor as it is running in background.
Next, run
sde -l halomosfet_sde.cmd
You will see sde working to generate the MOSFET mesh. You can then close the sde program. At this point, you can also use tecplot_sv to inspect the structure produced.
5.6. Sdevice Commands
Recall that we have three *des.cmd files. Let us take the idvglin_des.cmd as an example.
File {
   * input files:
   Grid=   "n9_msh.tdr"
   Parameter="pp57_des.par"
   * output files:
   Plot=   "n57_des.tdr"
   Current="n57_des.plt"
   Output= "n57_des.log"
}

Electrode {
   { Name="source"    Voltage=0.0
   * Resistor=40
   }
   { Name="drain"     Voltage=0.0
   * Resistor=40
   }
   { Name="gate"      Voltage=0.0 }
   { Name="substrate" Voltage=0.0 }
}

Insert = "PhysicsSection_des.cmd"
Insert = "PlotSection_des.cmd"
Insert = "MathSection_des.cmd"

      CurrentPlot{
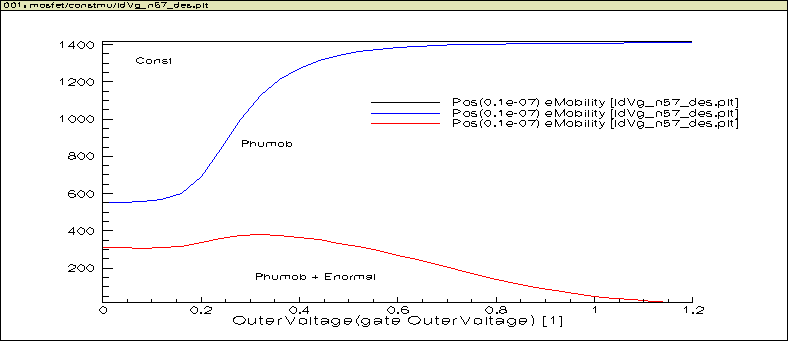
                 eMobility((0 0.0000001))
                 ElectricField/Vector((0 0.0000001))
                 evelocity((0 0.0000001))
                 ElectrostaticPotential((0 0.0000001))
                 eDensity((0 0.0000001))
                 }


Solve {
*- Creating initial guess:
    coupled(Iterations=100)  {Poisson
 }
   Coupled { Poisson Electron
 }
   Coupled { Poisson Electron Hole
 }

*- Ramp to drain to Vd
   Quasistationary(
      InitialStep=1e-2 Increment=1.35
      MinStep=1e-5 MaxStep=0.2
      Goal { Name="drain" Voltage=0.05
 }
   ){ Coupled { Poisson Electron Hole
 } }

*- Vg sweep
   NewCurrentFile="IdVg_"
   Quasistationary(
      DoZero
      InitialStep=1e-3 Increment=1.5
      MinStep=1e-5 MaxStep=0.04
      Goal { Name="gate" Voltage=1.2
 }
   ){ Coupled { Poisson Electron Hole
 }
      CurrentPlot(
                 Time=(Range=(0 1) Intervals=30)
                   )
*     plot(FilePrefix="n57_snap" Time=(Range=(0 1) intervals=6) NoOverwrite)
   }
}
5.6.1. Physics Selection
The statement
Insert = "PhysicsSection_des.cmd"`
inserts the file PhysicsSection_des.cmd whose content is:
Physics{
*   EffectiveIntrinsicDensity( OldSlotboom )
}

Physics(Material="Silicon"){

   Mobility(
*      PhuMob
*      eHighFieldSaturation( GradQuasiFermi )
*      hHighFieldSaturation( GradQuasiFermi )
*      Enormal
   )

*  Recombination(
*    SRH( DopingDep )
*    Band2Band
* )
}
Note that the * at the line beginning is for commenting out the line. So by default, in the mobility section, none of the options is active.
So default simulation will use a constant mobility. We can remove the * one by one to produce difference combinations. For now, let us still keep the high field saturation turned off. We will turn on Phumob only, and then turn on Phumob and Enormal.
Physics(Material="Silicon"){

   Mobility(
       PhuMob
*      eHighFieldSaturation( GradQuasiFermi )
*      hHighFieldSaturation( GradQuasiFermi )
*      Enormal
   )

*  Recombination(
*    SRH( DopingDep )
*    Band2Band
* )
}
and
Physics(Material="Silicon"){

   Mobility(
       PhuMob
*      eHighFieldSaturation( GradQuasiFermi )
*      hHighFieldSaturation( GradQuasiFermi )
       Enormal
   )

*  Recombination(
*    SRH( DopingDep )
*    Band2Band
* )
}
We talked about the meanings of these choices in class. You can find more information in the sdevice_ug.pdf manual under /linux_apps/synopsys/v2.5/sentaurus/tcad/E-2010.12/manuals/PDFManual/data.
You may want to create a new folder or sub-folder for different options, as files with the same names will be overwritten. Instead of changing all file names in your command files, you can simply create a new folder with names like muvertical or phumob to indicate what the folder is about.
Of course, do not forget about changing the content after you create or duplicate the folder content via copy and paste.
5.6.2. Tracking Data at a Position Varying with Bias
A very advanced option in running TCAD simulation is to track how the internal physics data, e.g. mobility, or velocity, at a given position changes with bias.
This can be very useful for insight. For instance, one can look at how eVelocity changes with high field saturation on and off at different points along the channel. One will see different degree of velocity saturation.
In our case, let us plot out a few quantities at the center of the channel between source and drain, at the surface. As y=0 is not so good a choice, because it can be treated as inside the oxide by the simulator, let us use y=1e-7 instead. It ensures we are going to be looking at a point really close to surface, but inside Si.
This is achieved above by these lines:
CurrentPlot{
           eMobility((0 0.0000001))
           ElectricField/Vector((0 0.0000001))
           evelocity((0 0.0000001))
           ElectrostaticPotential((0 0.0000001))
           eDensity((0 0.0000001))
           }
It is very important to use parentheses to specify the coordinate, which is given as one to three (depending on device dimensions) numbers in parentheses. In this case, we are running 2-D simulation. So we are asking the program to give us required quantities at x=0, y=0.0000001.
The parentheses distinguish coordinates from node numbers, which you can find out using tecplot_sv. Do not worry about it for now. Just use coordinates. The advantage is that no interpolation is required. When specifying coordinates, the program will have to do interpolation using values at the nearby nodes in your grid / mesh.
5.7. Homework
Start with this. We will turn this into a midterm project next week.
- Try a 45nm, 65nm, or 90nm device with the mobility choices given above. Keep high field saturation turned off for now. Compare Id-Vg linear, saturation and Id-Vd curves.
- Turn on and off the two high field saturation switch with all other options in Mobility section turned on. Do this for 90nm and 1um. Compare Id-Vd curves by overlaying them. Do this one gate voltage at a time.
- Try to track lateral field (Ex) and velocity at the center of channel at surface as a function of Vd at the highest gate voltage.


