
Three-Dimensional Large Scale Motions in Zero Pressure Gradient and Adverse Pressure Gradient Turbulent Boundary Layers
- Student: Blake Melnick
- Funding Agency: Army Research Office
This work is focused on investigating three-dimensional structures in zero pressure gradient and adverse pressure gradient turbulent boundary layers. While researchers have a pretty good picture some of the structures in a turbulent boundary layer (hairpin vortices, large scale motions, turbulent bulges, coherent structures, sweeps, and ejections), there is still much to be learned about the underlying physics of turbulent boundary layers. In particular more investigation into the three-dimensional structures of an adverse pressure gradient turbulent boundary layer would be beneficial for many areas of fluid dynamics.
Boundary layer separation can have negative consequences in some situations (large total pressure losses, decreased heat transfer, loss of control, and loss of lift), so being able to give more information about these structures in an adverse pressure gradient that is on the verge of separation would be insightful. How do these structures change their shape, size, orientation, and spacing as they get closer to separation? Could detailing these changes give clues to the underlying physics, and possibly how can we prevent separation?
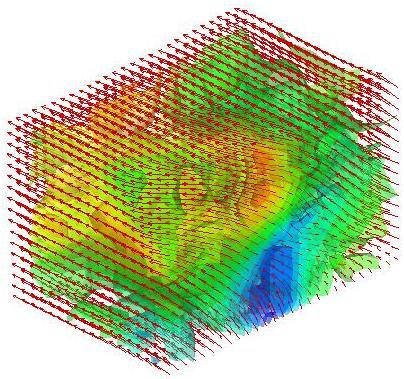
The Auburn University Advanced Laser Diagnostics Laboratory has two 3-D measurement techniques that we are using to investigate the turbulent boundary layer structures. A 3-D flow visualization technique that utilizes a home-built pulse burst laser that emits 68 laser pulses at a rate of 500 kHz in conjunction with a scanning mirror and a high-speed camera captures instantaneous 3-D snapshots of the turbulent boundary layer as shown in Figure 1. In addition, a newly developed plenoptic camera can capture a 3-D velocity field of the turbulent boundary layer as shown in Figure 2.
|
|

For more information:
- Williams, S. T., Melnick, M. B., and Thurow, B., “3-D visualization of a turbulent boundary layer,” AIAA Paper 2010-4277, 41st AIAA Fluid Dynamics Conference, Chicago, June 2010.
- Melnick, M. B., and Thurow, B., “Simultaneous 3-D flow visualization with 2-D PIV to observe a turbulent boundary layer,” AIAA Paper 2011-750, 49th AIAA Aerospace Sciences Meeting, Orlando, January 2011.
- Lynch, K., and Thurow, B., "Preliminary Development of a 3-D, 3-C PIV Technique Using Light Field Imaging," AIAA Paper 2011-3729, 42nd AIAA Fluid Dynamics Conference, Hawaii, June 2011.
- Lynch, K., Fahringer, T., and Thurow, B., "Three-Dimensional Particle Image Velocimetry Using a Plenoptic Camera," AIAA Paper 2012-1056, 50th AIAA Aerospace Sciences Meeting Nashville, Tennessee, January 2012.
- Melnick, M. B., and Thurow, B., “Experimental investigation of a turbulent boundary layer using simultaneous 3-D flow visualization and 2-D PIV,” AIAA Paper 2012-0752, 50th AIAA Aerospace Sciences Meeting, Nashville, January 2012.
- Melnick, M. B., Thurow, B., Fahringer, T., and Brock, B., “Experimental investigation of three-dimensional structures in an adverse pressure gradient turbulent boundary layer.” AIAA Paper 2012-2850, 42nd AIAA Fluid Dynamics Conference, New Orleans, 2012.
- Fahringer, T., and Thurow, B., "Tomographic reconstruction of a 3-D flow field using a plenoptic camera," AIAA Paper 2012-2826, 42nd AIAA Fluid Dynamics Conference, New Orleans, 2012.
- Melnick, M. B., Thurow, B., and Brock, B., “Flow visualization of three-dimensional large scale motions in ZPG and APG turbulent boundary layers,” AIAA Paper 2013-535, 51st AIAA Aerospace Sciences Meeting, Grapevine, TX, January 2013.


![]()