- Fall 2016
Twins at Birth Differed as They Aged, by Don Watson
Three years ago I gained the honor of becoming a grandfather to twins. Although they were not identical (one is a boy and the other is a girl), it was impossible to look at their faces and tell them apart when they were born. The pink and blue blankets they were wrapped in were an invaluable tool to distinguish which one I was holding. Today, their facial features are quite different and one can easily tell them apart.
During a recent NCAT research study, a similar story developed concerning two asphalt mixes. The two porous friction course (PFC) asphalt surfaces were originally identical as far as one could tell. Both mixes used approved granite aggregate sources which met the same materials specifications, were mixed with polymer modified asphalt binder meeting the same performance grade, were designed using the same mix design procedure, and had the same optimum asphalt binder content. For practical purposes, the mixes were identical.
Just as with my grandchildren, the differences became more pronounced as the mixes aged. One mix was placed on an interstate project with 200,000 average annual daily traffic (AADT) and lasted for more than 18 years before needing to be replaced. The other mix was placed on an interstate project with 50,000 AADT but began raveling and had to be replaced in less than eight years. This causes one to wonder how performance could be so different when both mixes met the same specification criteria.
The mix design procedure used to determine optimum asphalt content for the two mixes relied on what is referred to as the “pie-plate” test where batched aggregate samples are blended with asphalt binder in 0.5% increments. The mix is placed in a clear pie plate (taking care not to slide the mix over the plate surface) and returned to a fan-forced oven for a specified length of time at mix production temperatures. Afterward, the samples are removed from the oven and allowed to cool. The plates are then inverted and the amount of drain-down is observed (Figure 1). It is desirable to have a slight puddle of binder where the binder film coating the aggregate particle contacts the plate surface. This drain-down is believed to ensure that the particles will bond to the existing surface during construction. However, the drain-down method for selecting optimum asphalt content is no longer practical for some agencies because modified asphalt binders and fiber stabilizers are now added to the mixtures to avoid binder drain-down.
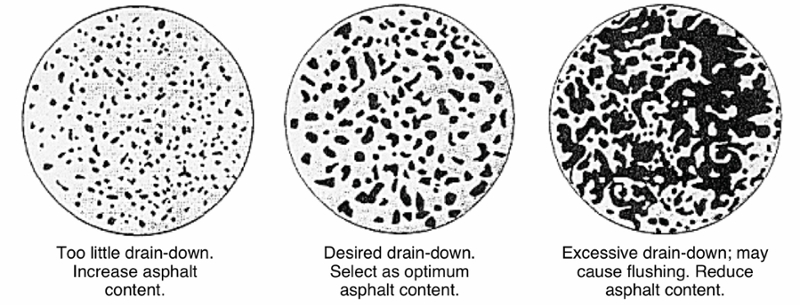
Figure 1: Drain-Down Method for Determining Optimum Asphalt Content
Two nationally recognized test procedures, ASTM D7064-08 and AASHTO PP 77-14, have been developed for practitioners designing PFC mixtures, but neither of the procedures is widely used. The ASTM method recommends optimum asphalt content be based on meeting a minimum air void criteria and maximum drain-down value. Moisture susceptibility testing must result in a minimum tensile strength ratio (TSR) of 80%. The Cantabro test, a test used to evaluate durability, and a permeability test are optional. Obviously, a lower asphalt content will result in higher air voids and less potential for drain-down. The weakness in this procedure is that it ensures that the lowest asphalt content within agency specification ranges will be selected as optimum so long as the TSR requirements are met.
The AASHTO mix design procedure, TP 77-14, is similar to the ASTM procedure but it incorporates the Cantabro test, AASHTO TP 108, into the design procedure. Some agencies have reported satisfactory PFC performance with Cantabro stone loss values up to 20%. TP 77 also establishes a desirable air void range of 18-22%, which will limit how low the asphalt content may be.
Both ASTM and AASHTO procedures require moisture sensitivity testing (AASHTO T283-modified), but AASHTO TP77 requires only one freeze-thaw cycle while the ASTM procedure requires five cycles. ASTM also requires a minimum TSR value of 80% while AASHTO requires 70%.
A quick look at the Cantabro results for the two mixes discussed shows rather dramatic differences. The differences are significant enough that placement of the poor performing mix might have been avoided if the Cantabro test had been conducted during the mix design procedures. TP 108 requires that a compacted PFC sample be placed in a Los Angeles (L.A.) abrasion drum without the normal steel spheres. The drum is then rotated for 300 revolutions at 30-33 rev/min according to AASHTO T 96. The average loss reported is based on the results of three replicates at each asphalt content.
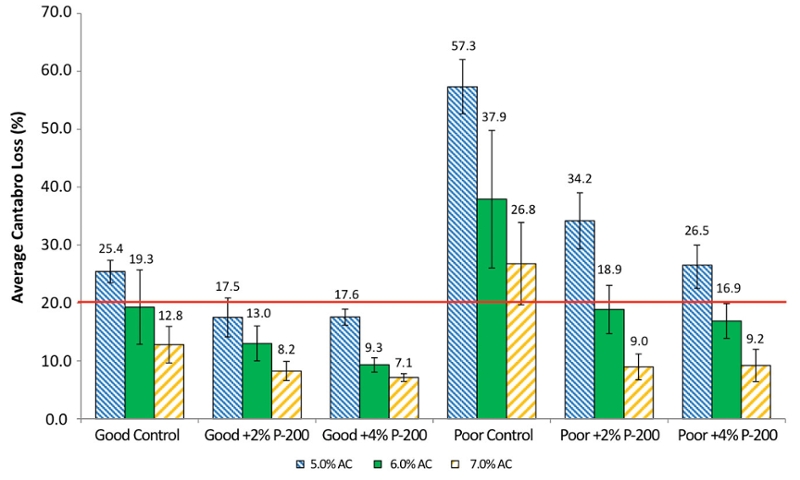
Cantabro stone loss was determined at three asphalt contents for the two mixes compared to the maximum recommended loss of 20%. The poor-performing mix failed badly with 37.9% stone loss and had nearly twice the amount of loss as the good-performing mix at the 6% optimum asphalt content. Increasing asphalt content is typically recommended to reduce Cantabro loss. In this case, however, it would require almost 8% asphalt by weight of total mix in order to meet the 20% maximum stone loss requirement. Increasing typical asphalt contents by 2% would significantly increase the cost of the mix to the point agencies may no longer consider it feasible to place PFC mixtures.
NCAT evaluated the effect of increasing the percent passing the No. 200 sieve (P-200) on Cantabro results. Additional mineral filler (baghouse dust) was added to a blend that originally contained about 2% total P-200. The additional filler was included at the rates of 2% and 4% by weight of aggregate. Figure 2 shows a significant improvement for the poor-performing mix as the P-200 content was increased. The amount of stone loss was reduced by one-half just by the addition of 2% baghouse dust without increasing asphalt binder content. In fact, increasing the total P-200 by 2% improved both mixes as well as (or better than) 1.0% additional binder.
A concern with adding P-200 in PFC mixes is that it will fill air voids and reduce the permeability of the mix. Such was the case with the good-performing mix. At 6.0% asphalt binder content, the mix only had 15.6% air voids before adding more dust. Adding just 2% more dust reduced the air voids below the minimum acceptable level of 15% and permeability was reduced by one-half. Table 1, however, shows that the poor performing mix still had acceptable air void levels and had permeability values well over the suggested minimum of 100 meters/day even with 5.6% total P-200. This means that performance of some PFC mixes can be improved considerably by increasing the total P-200 allowed in the mixture without increasing binder content and without reducing permeability to unacceptable levels. One benefit of this research is that mix designers may be able to use less costly standard quarry materials rather than washed coarse and fine aggregates.
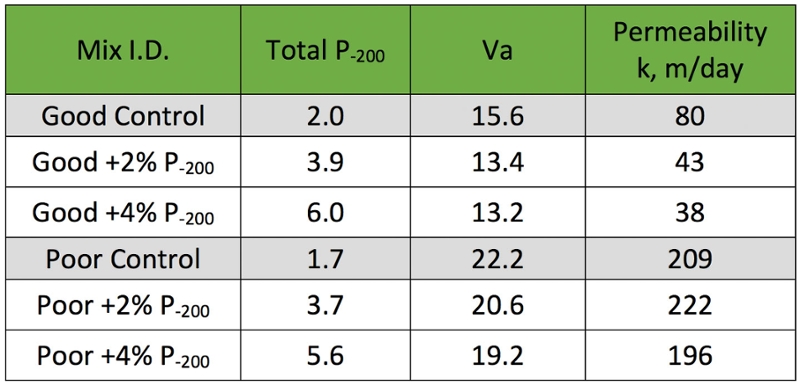
Table 1: Effect of P-200 on Air Voids (Va) and Permeability
Tensile strength tests were conducted to further evaluate the cohesiveness of PFC with increased P-200. AASHTO T 283 was modified as mentioned in AASHTO TP 77 for determining moisture susceptibility. Modifications to the test procedure include:
- - Compact to 50 gyrations instead of to a specific air void level,
- - Vacuum saturate for 10 minutes, and
- - Keep samples submerged during the freeze-thaw cycle.
Figure 3 shows that tensile strengths of both the good and poor mixes improved with the addition of P-200. For the good-performing mix, tensile strength increased for 2% additional P-200 but 4% additional P-200 did not provide any benefit. Tensile strength increased by 26% for unconditioned specimens and 48% for conditioned specimens when compared to the mixes without added P-200. TSR values ranged from 78% to 86%. The minimum TSR required in TP 77 is 70%.
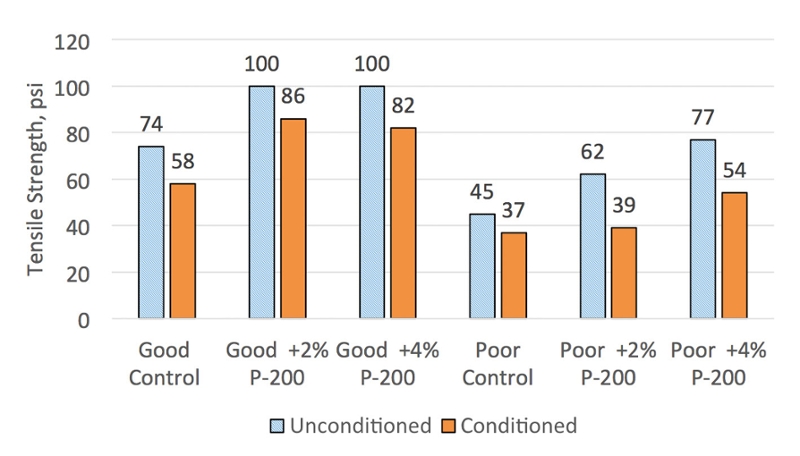
Figure 3: Tensile Strength Results of Unconditioned and Conditioned Specimens
The poor mix without added P-200 had a TSR value of 81%, but the strength was very low with only 45 psi for the unconditioned specimens and 37 psi for the conditioned set. The unconditioned strengths increased for the poor-performing mix with each of the additional P-200 levels. The unconditioned strength with 4% added P-200 was 71% higher than the control mix without added P-200. The conditioned strength changed very little with 2% added P-200 but increased by 46% with 4% additional P-200. These results show that the cohesive strength of a PFC mix can be increased considerably by increasing the P-200 content, and in some cases this can be done while still maintaining acceptable levels of permeability.
There are some important observations and conclusions that can be drawn from this research. First, just because two mixes meet the same specification criteria for materials does not ensure that both mixes will have equal field performance. All mix design procedures, including PFC, should include performance tests and criteria. The performance tests should address the main types of distress encountered by the pavement. This important step will help avoid the use of mixtures with inherent weaknesses that otherwise may not manifest until placed in service. Secondly, contrary to previous philosophies regarding minimizing P-200 in PFC mixtures, some additional P-200 may help improve cohesive strengths of the mixtures and reduce the potential for raveling. Less expensive aggregate may be used in PFC production because washed coarse and fine aggregate is not needed.
In summary, it is possible to improve the durability of PFC pavements by implementing performance tests such as the Cantabro wear test, the modified moisture susceptibility test, and the permeability test as part of the laboratory mix design procedure. Agencies should also consider allowing higher P-200 contents to improve mixture cohesion and tensile strength. In doing so, those twin pavements may continue their similarities throughout many years of performance.