- Fall 2016
Comparing Pavement Preservation Treatments
Highway agency interest in pavement preservation has grown significantly over the last five to ten years. The theme “Keeping Good Pavements Good” is critical to maintaining pavement assets. There are a number of pavement preservation treatments (PPTs) available to agencies. Engineers and program administrators typically use a cost-effectiveness measure to compare PPT alternatives similar to using life-cycle cost analysis for determining the best pavement rehabilitation or reconstruction alternative. The depth of the cost-effective analysis will play a role in selecting the most appropriate PPT alternative.
Many reports on PPT define cost-effectiveness as the cost of the PPT application (construction) divided by the lane-miles covered to establish a unit cost per lane-mile, which is further divided by the anticipated life of the treatment to obtain a unit cost per lane-mile per year of service. This is a reasonable method to begin a comparison between PPTs, but requires a set of definitions to consistently compare alternatives. The defined cost must include the same construction items, such as material cost, pavement preparation, placement cost, and traffic control. More difficult to define is the anticipated service life. Each PPT has a unique service performance curve that the agency must determine. The agency should establish a threshold service condition that can be reasonably measured. It can be as simple as a measure of roughness (ride) or more complicated as a pavement condition index that combines multiple measures such as ride + cracking + rutting. The anticipated PPT service life is quantified as the time to reach that defined level of service.
In Figure 1, two PPTs are shown to reach the target service condition in the same length of time, so the difference in cost will determine which PPT is the most cost-effective. However, the two PPTs do not provide the same level of pavement service over the anticipated service time. The level of service during the service time is an appropriate second consideration in developing a procedure to compare alternatives. As shown in Figure 1, PPT-A (red) provides GOOD performance for 75% of the service time, while PPT-B (green) only provides GOOD service for 50% of the time. Quantifying the value of the level of service is not a current common practice but needs to be further explored. If a project requires a PPT with a smooth ride and low noise, then the cost-effective value of a given PPT should account for that desired level of service. If another project requires high friction properties, then each PPT alternative should include the friction performance as part of the cost-effectiveness.
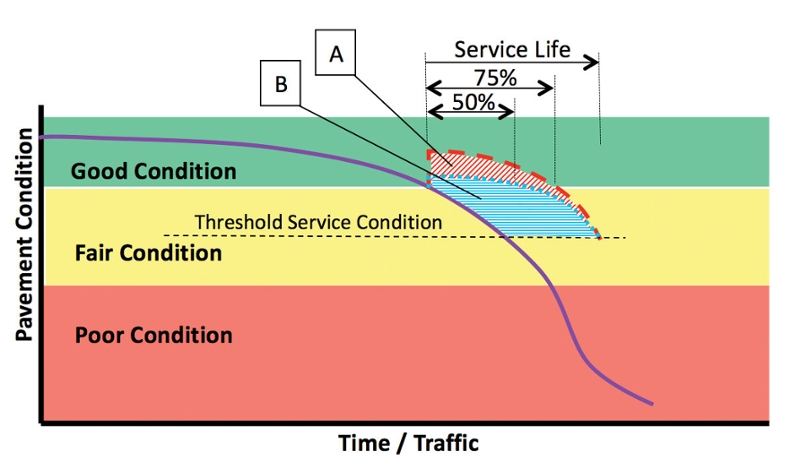
Figure 1: Comparing Service Life and Level of Service